1801 PLAYFAIR, William (1759 – 1823)
The statistical breviary; shewing, on a principle entirely new, the resources of every state and kingdom in Europe; illustrated with stained copperplate charts, representing the physical powers of each distinct nation with ease and perspicuity. To which is added, a similar exhibition of the ruling powers of Hindoostan.
In this work Playfair invented the pie chart. It has also been suggested that Playfair, often short of funds, may have colored the charts in all the copies himself—the process he characterized as "staining" in the tit…
GMN 8148 · https://historyofmedicine.com/id/10324
1834 CHÂTEAUNEUF, Louis-François Benoiston de (1776 – 1856)
Rapport sur la marche et les effets du choléra-morbus dans Paris et les communes rurales du département de la Seine par la commission nommée, avec l'approbation de M. le ministre du commerce et des travaux publics, par MM. les préfets de la Seine et de police; année 1832.
This work contained one of the earliest applications of spatial analysis in epidemiology—an early thematic map by geographer and cartographer Charles Picquet, in which the 48 districts of Paris were represented by gra…
GMN 7480 · https://historyofmedicine.com/id/9652
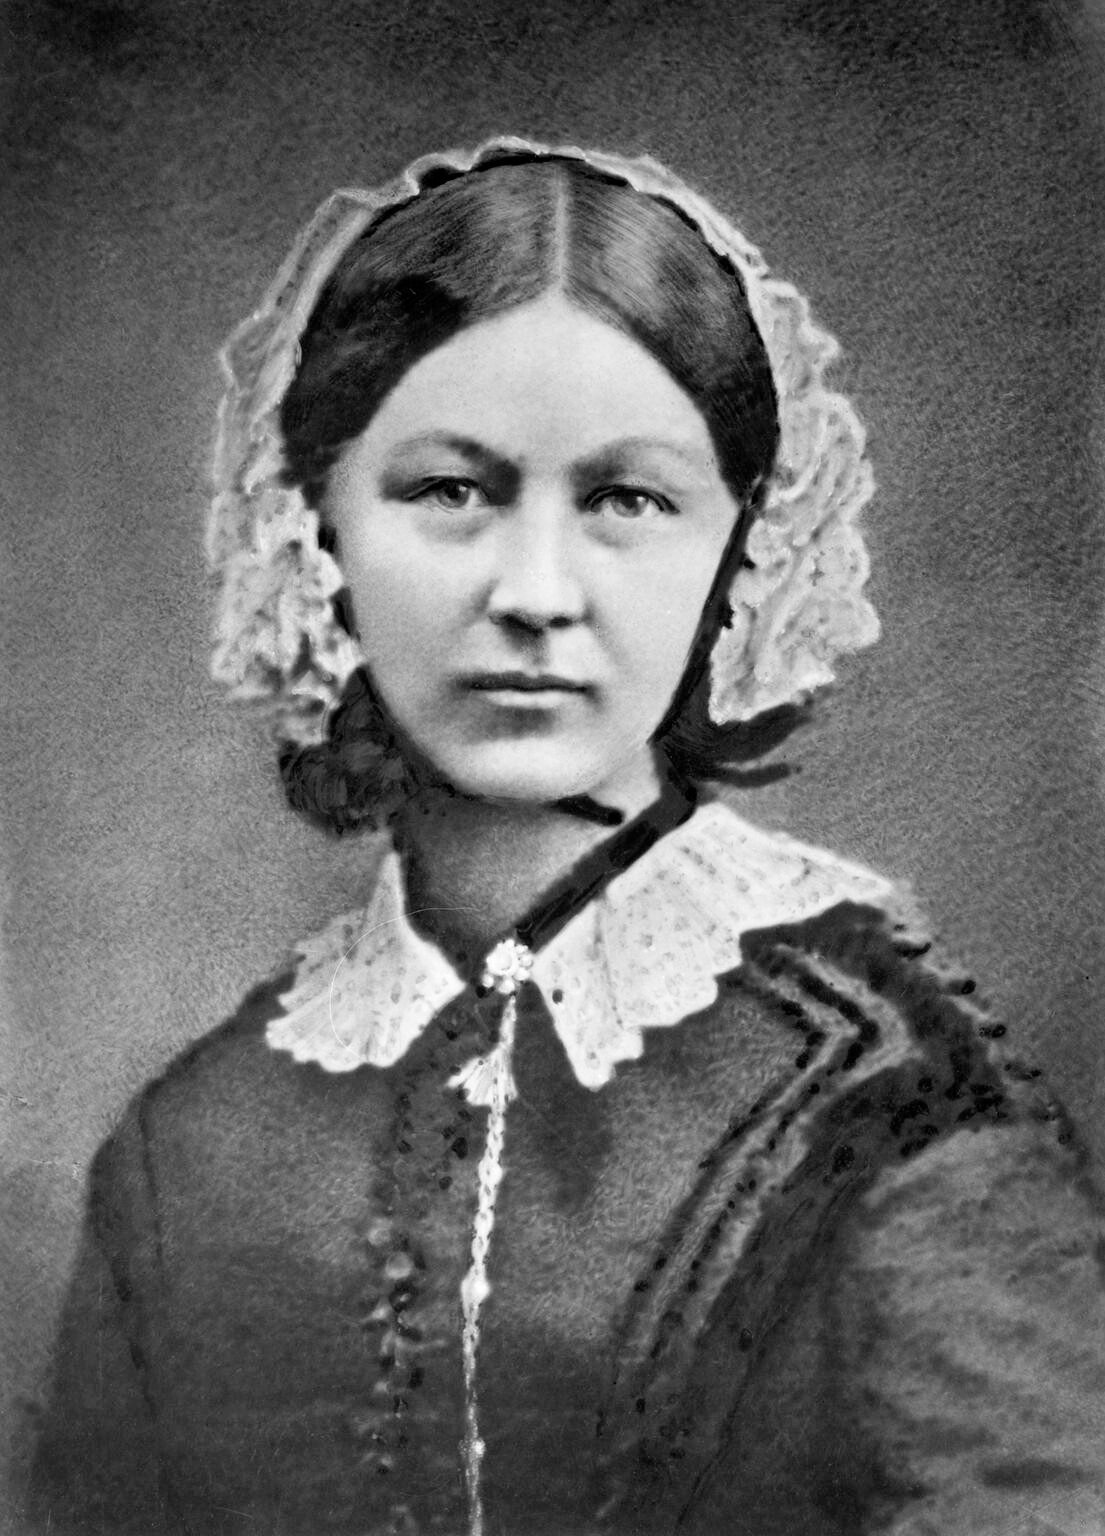
1858 NIGHTINGALE, Florence (1820 – 1910)
Notes on matters affecting the health, efficiency, and hospital administration of the British Army. Founded chiefly on the experience of the late war. Presented by request to the Secretary of State for War.
This privately printed pamphlet contained a color statistical graphic entitled "Diagram of the causes of mortality in the Army of the East" which showed that epidemic disease, which was responsible for more British de…
GMN 7481 · https://historyofmedicine.com/id/9653
1874 WALKER, Francis Amasa (1840 – 1897)
Statistical atlas of the United States based on the results of the ninth census 1870, with contributions from many eminent men of science and several departments of the government.
This oversized compendium of maps, graphs, statistical tables, and essays was the first comprehensive thematic atlas produced by any nation. It was hailed both at home and abroad for its innovative use of graphic elem…
GMN 7479 · https://historyofmedicine.com/id/9651
1878 MAREY, Étienne Jules (1830 – 1904)
La méthode graphique dans les sciences expérimentales et particulièrement en physiologie et en médecine.
Marey pioneered the use of graphical recording in the experimental sciences, using instruments (many of his own invention) to capture and display data impossible to observe with the senses alone, and to record the pro…
GMN 7294 · https://historyofmedicine.com/id/9464
1967 BERTIN, Jacques (1918 – 2010)
Sémiologie graphique: Les diagrammes. Les reseaux. Les cartes.
Foundational work in design and cartography concerning the graphic display of quantitative information. Includes display of medical or statistical information. Translated into English by William J. Berg as Semiology o…
GMN 7699 · https://historyofmedicine.com/id/9871
1978 U.S. BUREAU OF THE CENSUS
Graphic presentation of statistical information: Papers presented at the 136th annual meeting of the American Statistical Association, Social Statistics Section: Session of Graphical Methods for Presenting Statistical Data: Boston, Massachusetts, August 23-26, 1976, Vol. 3.
Digital facsimile from Google Books at this link.
GMN 8122 · https://historyofmedicine.com/id/10298
2011 LIMA, Manuel (1978 – )
Visual complexity: Mapping patterns of information.
An exceptionally beautiful graphic work with many historical examples showing how data in many fields, including medicine and biology, can be mapped and visualized.
GMN 10563 · https://historyofmedicine.com/id/12756
2013 MEIRELLES, Isabel
Design for information: An introduction to the histories, theories, and best practices behind effective information visualizations.
Visually splendid; includes frequent comparisons of modern computer representations with historical examples.
GMN 10564 · https://historyofmedicine.com/id/12757